Build dashboards around your questions
Combine totals, trends, and breakdowns in saved dashboards. Every chart follows the dashboard’s top-bar date range, so recurring reports stay consistent.
How to install ↗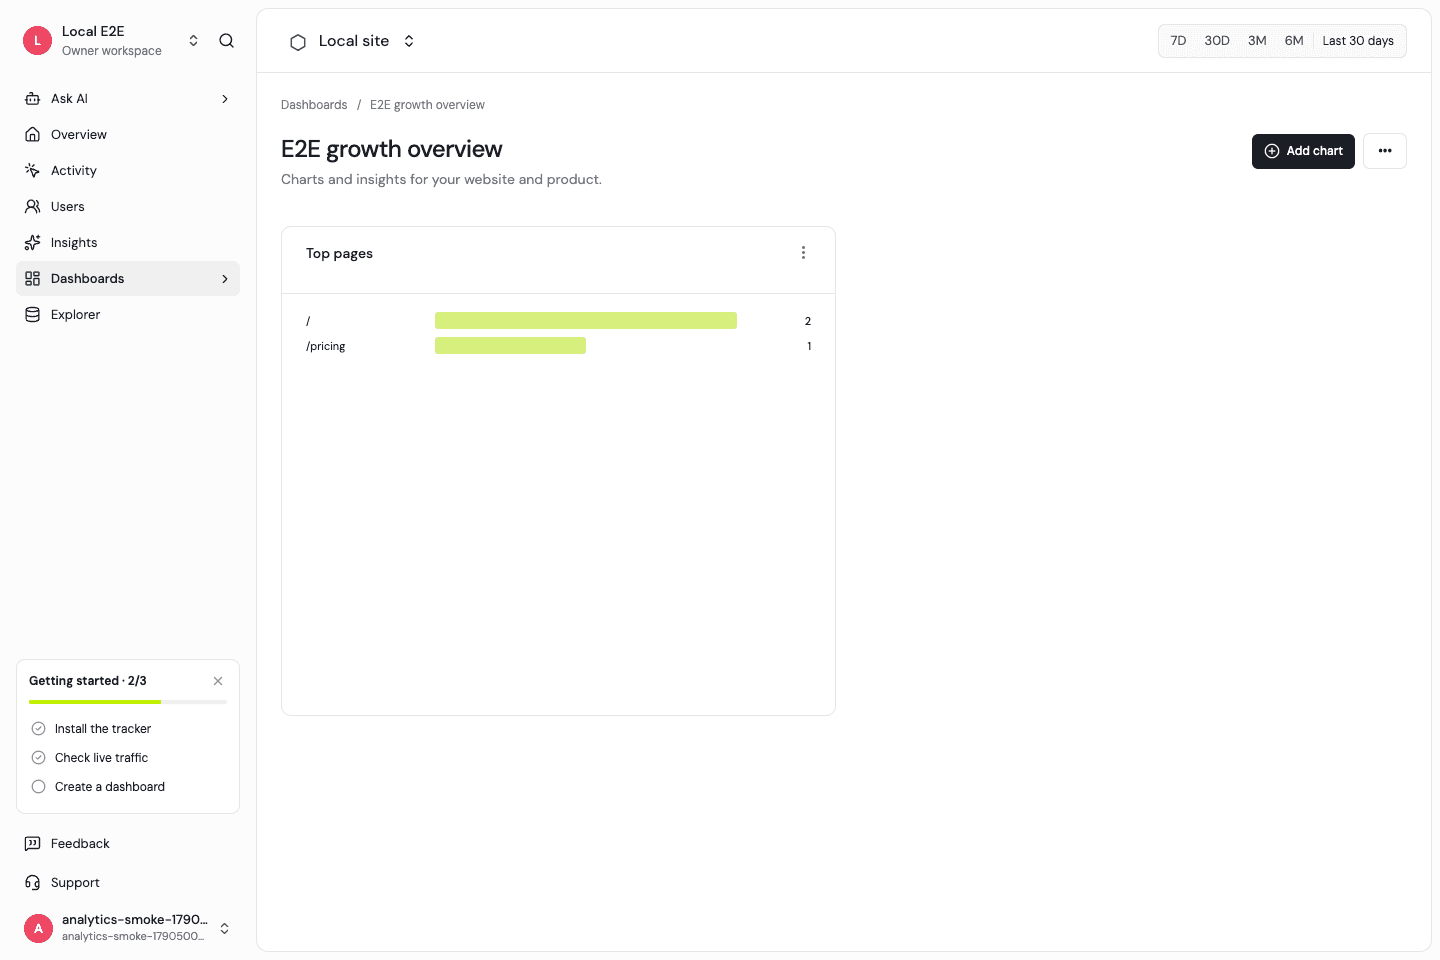
Choose a metric and a chart
Create number, line, area, bar, pie, or table cards. Chart choices depend on the metric: time-based metrics support trends, while category breakdowns support bars, pies, and tables. A pie chart is not available for every metric.
Start from a useful template
Use web traffic, product activity, campaign performance, or site performance templates. Add and edit charts for visitors, pageviews, sessions, engagement, revenue, top pages, sources, events, and Web Vitals.
One date range for the whole dashboard
Use the top-bar datepicker and previous-period comparison. Saved metric charts resolve the selected date range at read time. You do not need to maintain a second datepicker or hard-code dates in every card.
Go deeper with SQL
The SQL Explorer supports read-only investigation over raw_events. Preset metric cards and SQL exploration use different query paths; do not assume that arbitrary SQL results can be rendered as every preset chart type.
Frequently asked questions
Which chart types are supported?
Number, line, area, bar, pie, and table. Available options depend on whether the result is a total, time series, or breakdown.
Can I save dashboards?
Yes. Dashboard definitions and charts belong to a project; analytics results stay in Tinybird.
Do the templates include crypto metrics?
No. Templates cover general website traffic, product activity, campaigns, and performance.
Start with a clear measurement model.
Install the SDK, then explore traffic and product activity with the same definitions.