Web analytics that connects traffic to activity
Measure daily visitors, sessions, pageviews, engagement, and revenue in one overview. Use the same date range and filters to explore the pages and sources behind each trend.
How to install ↗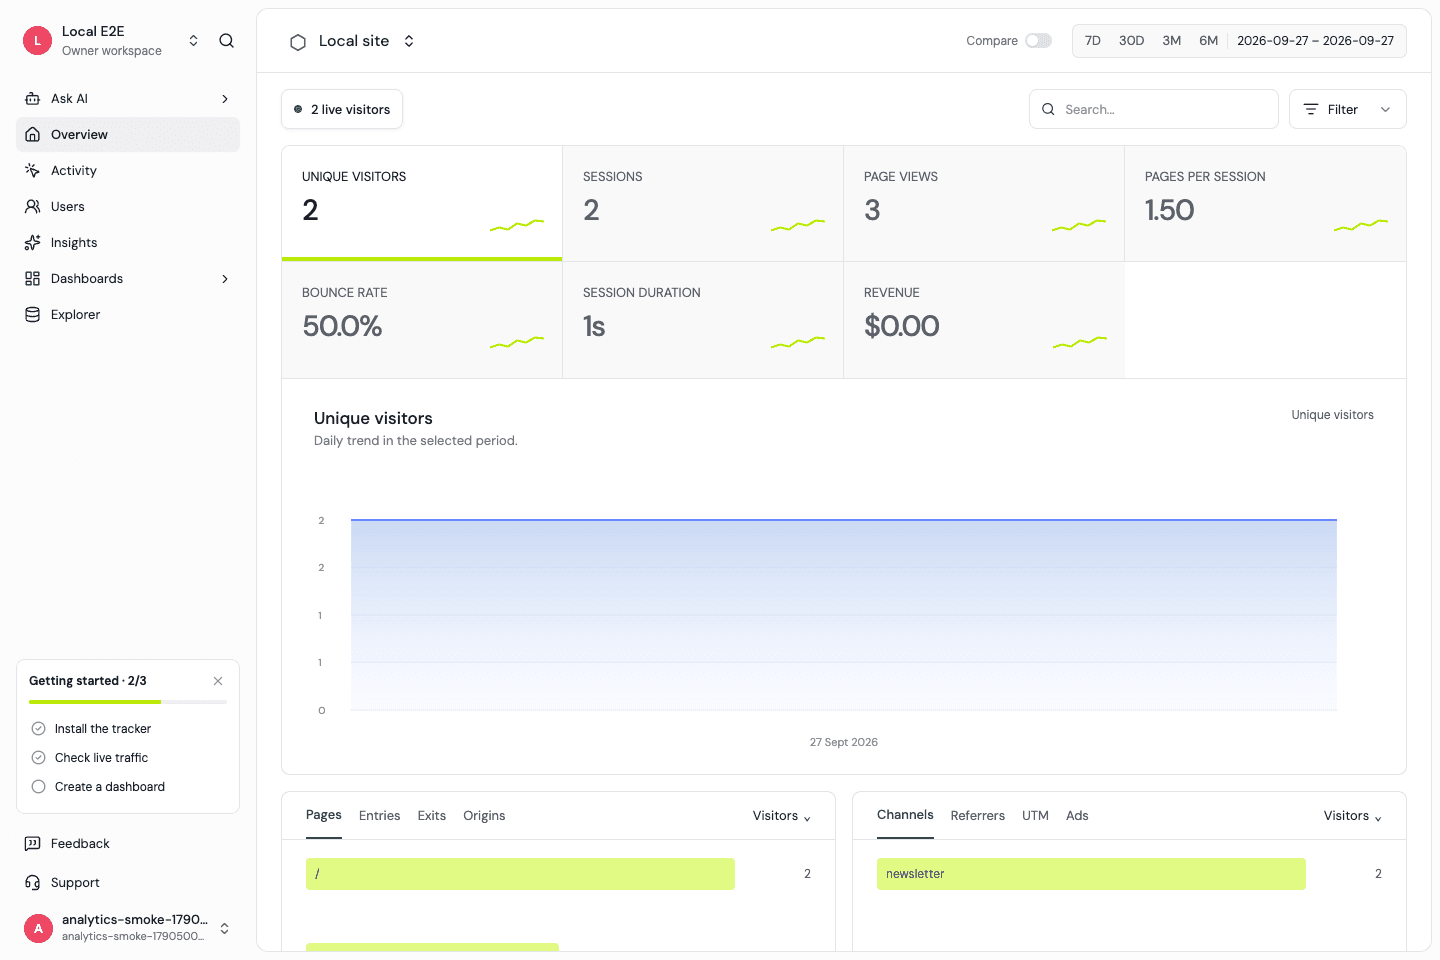
Start with seven core metrics
The overview tracks unique daily visitors, sessions, page views, pages per session, bounce rate, session duration, and revenue. Switch metrics to inspect the daily time series, or compare with the previous period.
Revenue comes from numeric revenue properties on custom events; it is not a payment-provider reconciliation report.
Find the pages and channels behind the numbers
Explore pages, entries, exits, referrer origins, channels, campaign parameters, and ad click information. Filter by desktop or mobile, country, browser, operating system, page, or campaign to investigate a change.
Understand what a visitor means
Anonymous IDs rotate each UTC day. A person returning tomorrow creates another daily ID. Sessions are reconstructed from activity with a 30-minute inactivity threshold and a UTC-day boundary. These are activity estimates, not lifetime unique-person counts.
From overview to investigation
Open live traffic from the live-visitors widget, inspect the event feed, or save a dashboard for a recurring question. Use named events such as signup_completed to connect traffic with product actions.
Frequently asked questions
Does this use analytics cookies?
No. Daily mode stores no browser identifier. Optional Attribution mode uses first-party localStorage only after project enablement and visitor consent; neither mode sets analytics cookies.
Can I see revenue?
Yes. You can send numeric revenue events or connect Stripe or Paddle for signed payment events and historical read imports. Refunds are reported separately. Currencies remain separate and are never silently converted; live provider histories still need validation.
Are counts comparable to GA4?
Metric definitions, identity, time zones, and collection rules differ. Compare the same event set and read the definitions before comparing totals.
Start with a clear measurement model.
Install the SDK, then explore traffic and product activity with the same definitions.